 Latent Equity
$BRK.B: defensive by cash, cyclical by business
Our read: $BRK.B trades like a safe haven, but most of what Berkshire owns still rises and falls with the economy. It's defensive by cash, cyclical by business.
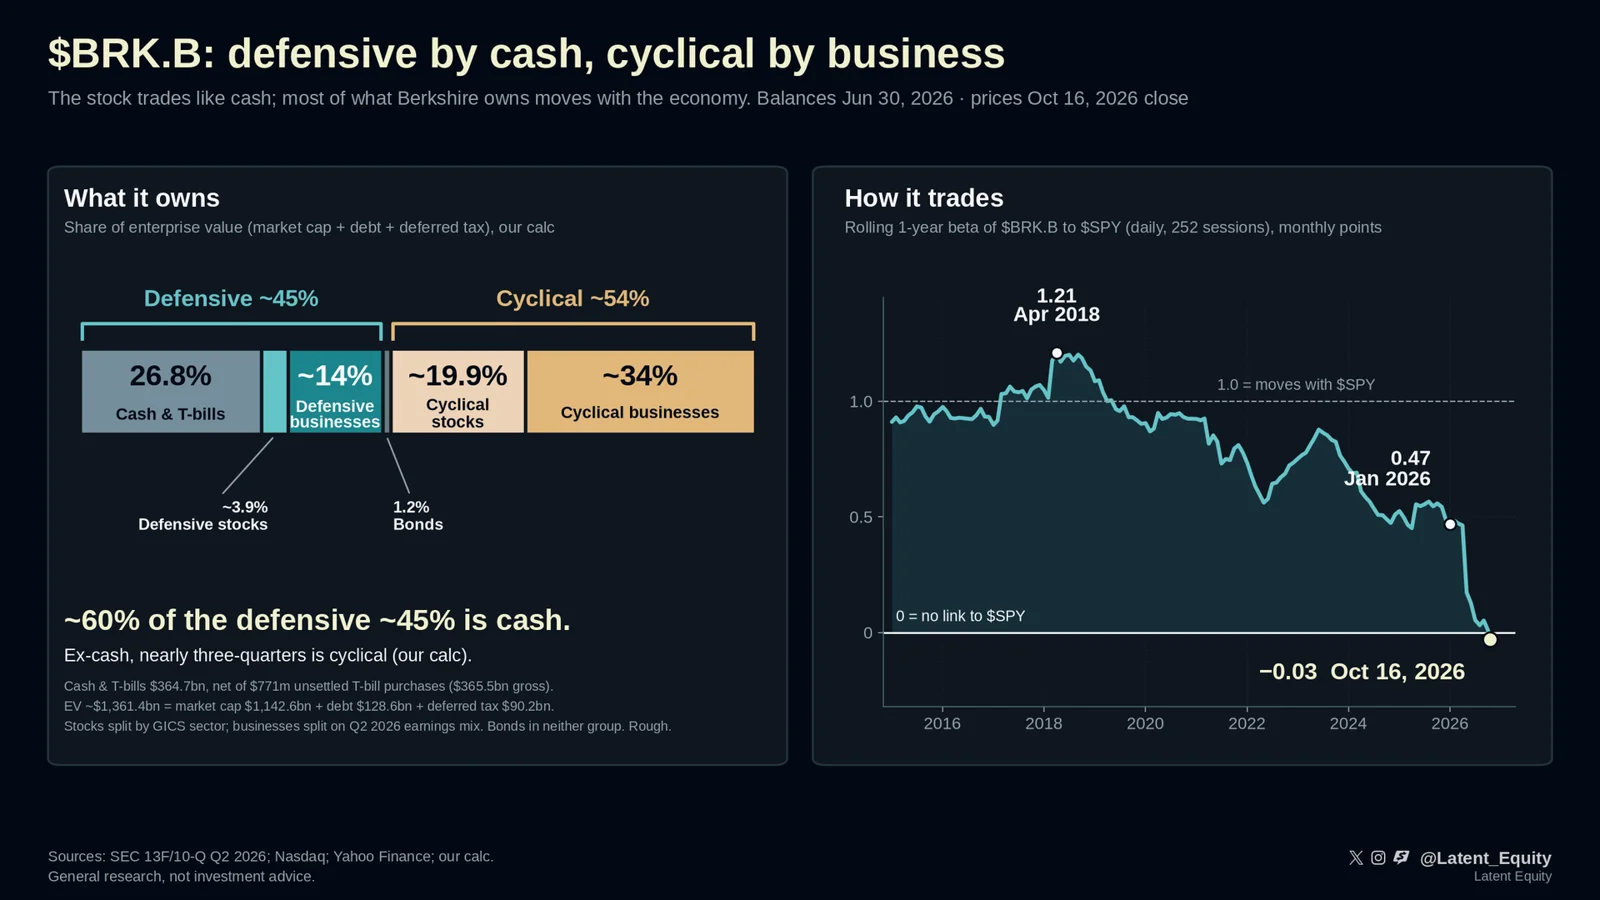
How it trades: in the risk-off week of Oct 9–16, $BRK.B rose 3.2% while $SPY fell 2.0% (our calc). Consumer staples ($XLP) did even better, at +5.0%. Its 1-year beta – how much a stock tends to move when the market moves – is −0.03, about zero (our calc, daily closes). As recently as January it was 0.47.
What it owns: we split Berkshire's enterprise value (market cap plus debt and deferred tax) into defensive and cyclical pieces. About 45% is defensive, and roughly 60% of that defensive part is cash and T-bills: $364.7bn at Jun 30, net of unsettled T-bill purchases, per the 10-Q. Exclude the cash and Berkshire is nearly three-quarters cyclical (our calc).
The businesses tell the same story. The BNSF railroad, the manufacturing, service and retail group, and equity-method stakes made 49.3% of Q2 after-tax operating earnings, excluding an FX gain (our calc). And 84% of the $299.25bn stock portfolio is cyclical by sector, led by $AAPL, $AXP, $GOOGL and $BAC (our calc, Q2 13F).
The catch: cash income shrinks when short-term rates fall. Pre-tax interest income fell 12.8% from a year earlier in Q2, which the 10-Q attributes to lower short-term rates. Our read: in a recession with Fed cuts, the cyclical businesses and the T-bill income could fall together. The defensiveness is a balance-sheet property, not an earnings property.
Is the strong run a warning sign for the market? Not by history. Over 30 years, there were 79 earlier times $BRK.B beat $SPY by more than 5 points over 10 days while $SPY fell (Oct 16 qualifies: +5.8% vs −0.8%). Over the next 3 months, $SPY averaged +4.1%, vs +2.8% for any 3-month window (our calc). The windows overlap, and we haven't tested this statistically. Drawdowns along the way were somewhat deeper (average max −6.6% vs −5.1%). Our read: volatility tends to persist. It's not a "the top is in" signal.
What would prove us wrong
Set before publication. We report back in public when one trips.
- The Q3 10-Q (early Nov) shows BNSF and the manufacturing, service and retail group holding or growing year over year while $SPY earnings estimates fall. Open · next check: Q3 10-Q (early Nov)
- The 1-year beta climbs back above ~0.6 by Q1 2027 without a change in the cash pile. Open · next check: Q3 10-Q (early Nov)
- Cash and T-bills drop below ~20% of total assets (from 28.9%) through deals or share repurchases. Open · next check: Q3 10-Q (early Nov)
- Interest income stops falling year over year, even if the Fed cuts. Open · next check: Q3 10-Q (early Nov)
- $SPY falls more than 10% within 3 months of Oct 16. One case wouldn't overturn 79, but we'd note it. Open · next check: Q3 10-Q (early Nov)
Method and sources
Figures marked "our calc" are our own arithmetic on the cited primary sources (company filings, earnings releases, public datasets). Every figure was checked against its source before publication.
General research, the same for every reader. Not investment advice.