 Latent Equity
$GOOGL's worst day since its IPO: what history says
$GOOGL just had its worst day since its 2004 IPO: -12.6%, about $500B of market value gone (our calc). The quarter showed search revenue up 12%, free cash flow of -$9.1B, and spending on data centers and equipment at 121% of the cash its operations brought in.
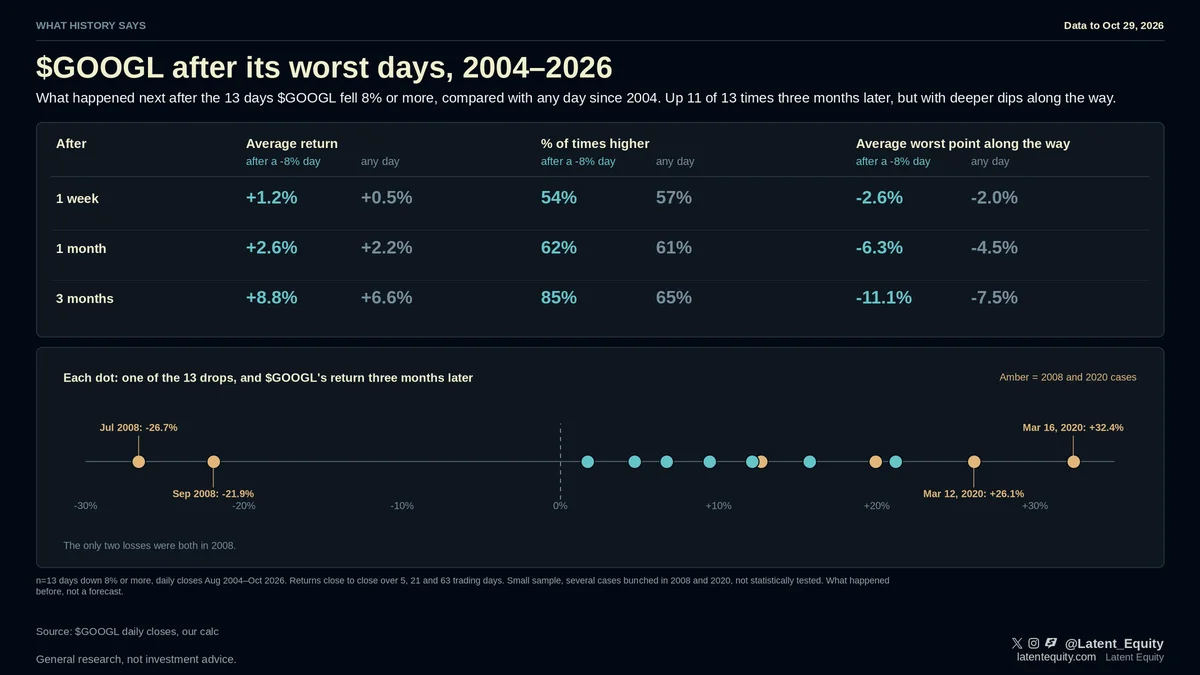
What history says: there have been 13 prior days of -8% or worse.
1 week later: up 54% of the time vs 57% for any day
3 months later: up 11 of 13, avg +8.8% vs +6.6% for any day
But the avg worst point inside those 3 months was -11%, vs -7.5% normally.
Caveats: only 13 cases, several bunched in 2008 and 2020, not statistically tested, and $GOOGL is a company that survived and grew, which flatters these numbers. This is what happened before, not a forecast.
Next check: $GOOGL Q4 report (early Feb 2027)
Method and sources
Figures marked "our calc" are our own arithmetic on the cited primary sources (company filings, earnings releases, public datasets). Every figure was checked against its source before publication.
General research, the same for every reader. Not investment advice.