 Latent Equity
Big one-day oil drops: what history says
Oil fell hard on Monday. This year, drops like that mostly haven't stuck.
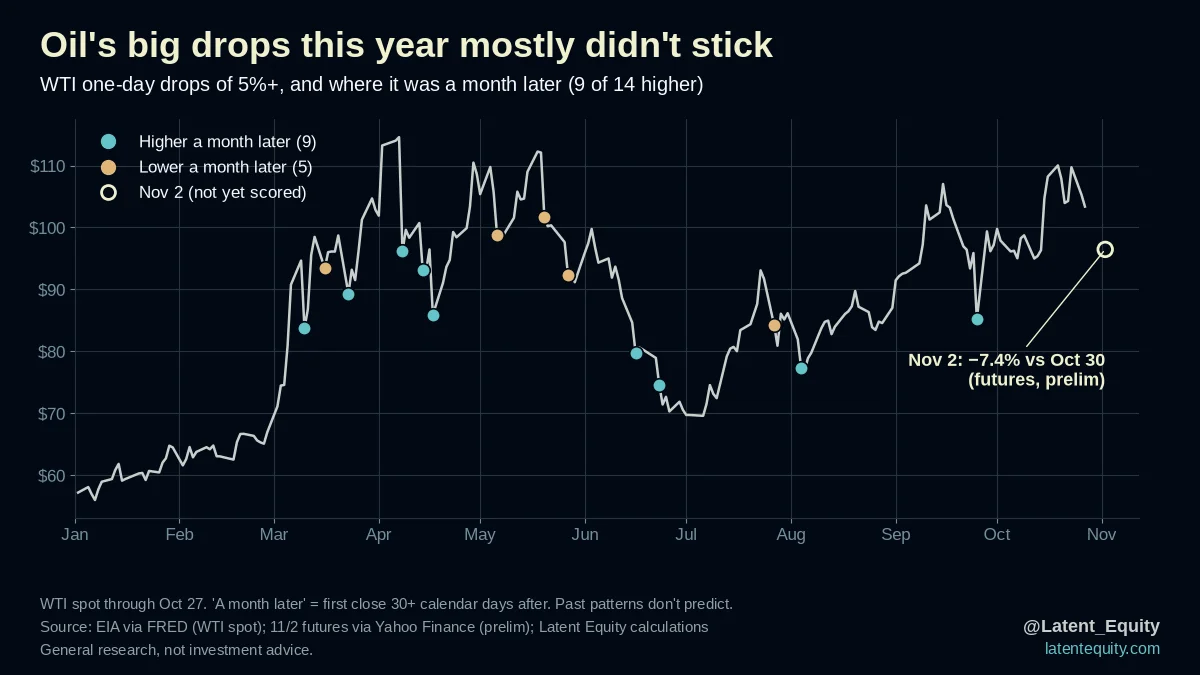
US crude (WTI, the main US oil price) futures fell 7.4% to $96.46. Brent, the global benchmark, fell 10.9% to $104.77. Both are early futures closes, not yet confirmed.
That was at least the 15th one-day drop of 5% or more in WTI this year.
Before Monday, there were 14. A month later, WTI was higher after 9 of them.
What it has meant for stocks: since 1986, WTI has had 63 one-day drops of 5.5% or more, counted at least 60 trading days apart. A year later, the S&P 500's median gain was +12.7%, vs +12.0% for all days (our calc). A month later: +1.4% vs +1.3%. Brent drops looked about the same.
Our read: a big oil drop on its own hasn't told stocks much, and this year most of them were reversed within a month.
What would tell us this time is different: Brent futures settling below $100 for 4 straight weeks (20 trading days). Monday's early close was still above $100.
Past patterns don't predict.
Next check: Brent futures vs $100, 20 trading days after Nov 2
Method and sources
Figures marked "our calc" are our own arithmetic on the cited primary sources (company filings, earnings releases, public datasets). Every figure was checked against its source before publication.
General research, the same for every reader. Not investment advice.