 Latent Equity
Oil spikes vs stocks: an event study
Our read: sharp oil spikes have been noise for stocks, not a signal.
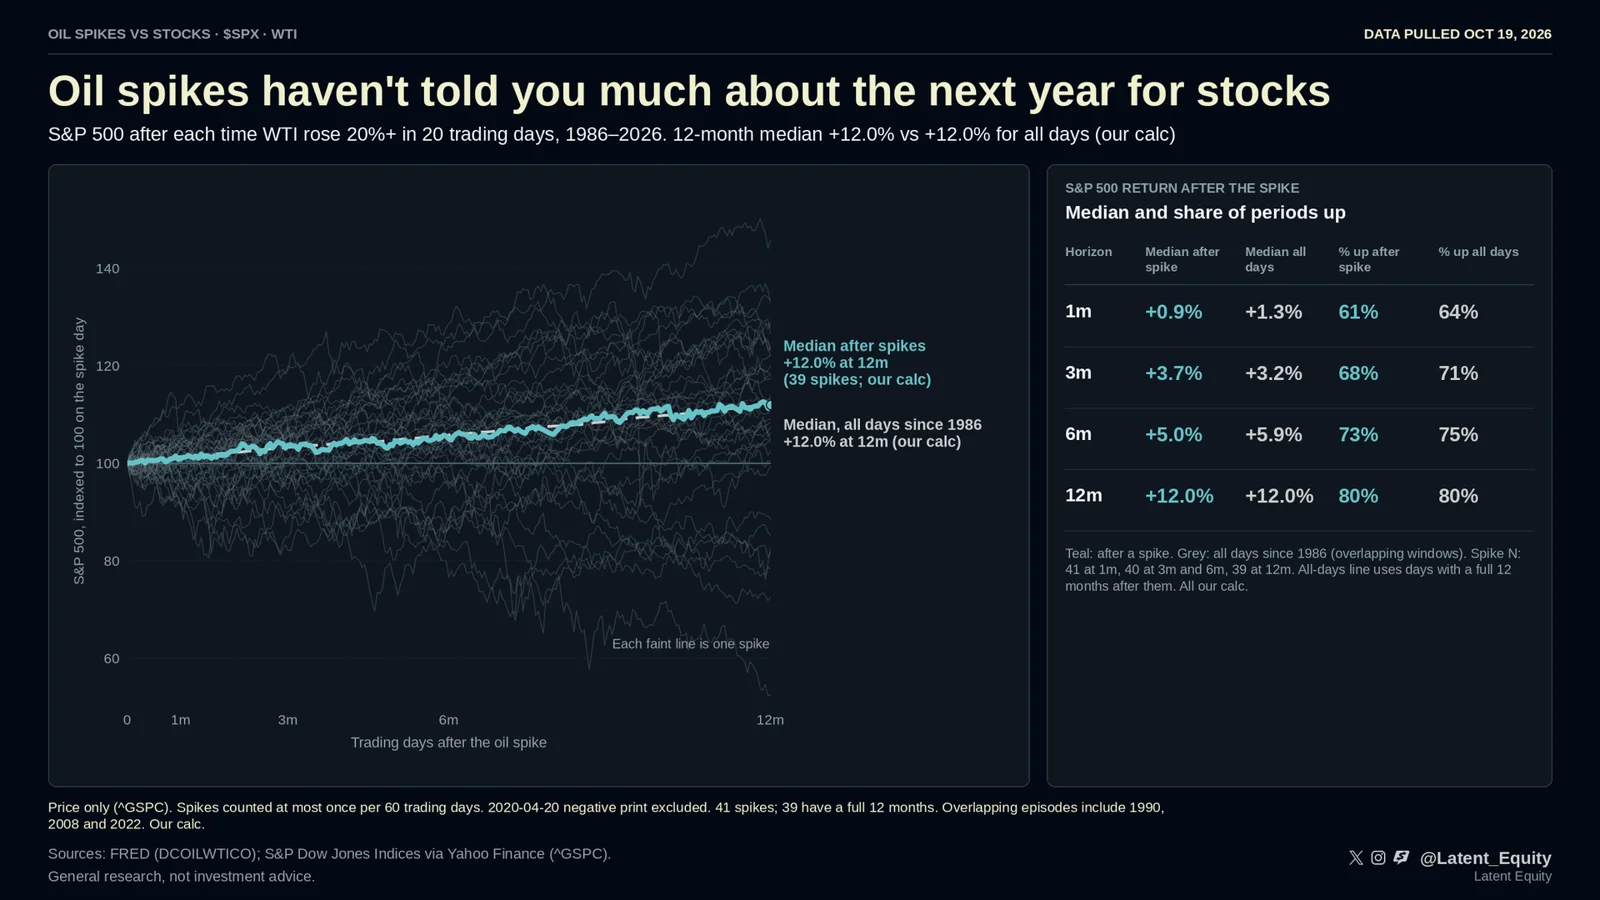
Since 1986, WTI crude has jumped 20% or more in 20 trading days 41 times (our calc). In the 39 with a full year of data, the S&P 500's median gain over the next 12 months was +12.0%. Across all trading days since 1986: also +12.0%.
In the past 39 spikes, the index was higher a year later 79.5% of the time. All days: 79.5%.
Change the test and it holds. The 12-month median after a spike (our calc):
- WTI +30% in 60 days: +10.9%
- WTI +25% in 20 days: +14.6%
- Brent +20% in 20 days: +14.0%
vs about +12% for all days.
Where it hurt: the six worst years after a spike (2000, 2001, 2002, 2007, 2008 and 2022; −14.8% to −47.6%) all overlapped a recession or a bear market. Most spikes that were rebounds from crashed oil prices (1986, 2009, 2016, 2020) were followed by strong years: 8 of 10 beat the all-days median (our calc).
Our read: the oil move on its own hasn't told you much about the next year. The economy it lands in has.
Small sample, overlapping regimes, price only. This is history, not a forecast.
What would prove us wrong
Set before publication. We report back in public when one trips.
- Future spikes push the 12-month hit rate below 70%, or the median more than 5 points under the all-days rate, with 40+ events. Open · next check: Next qualifying spike
- A spike outside a recession or bear market is followed by a 12-month loss of 15% or worse. Open · next check: Next qualifying spike
Method and sources
Figures marked "our calc" are our own arithmetic on the cited primary sources (company filings, earnings releases, public datasets). Every figure was checked against its source before publication.
General research, the same for every reader. Not investment advice.