 Latent Equity
Chips' October slump against the market was the widest since 2002, and the gap closed fast
Our read: chips' October slump against the market was extreme, and the gap closed fast.
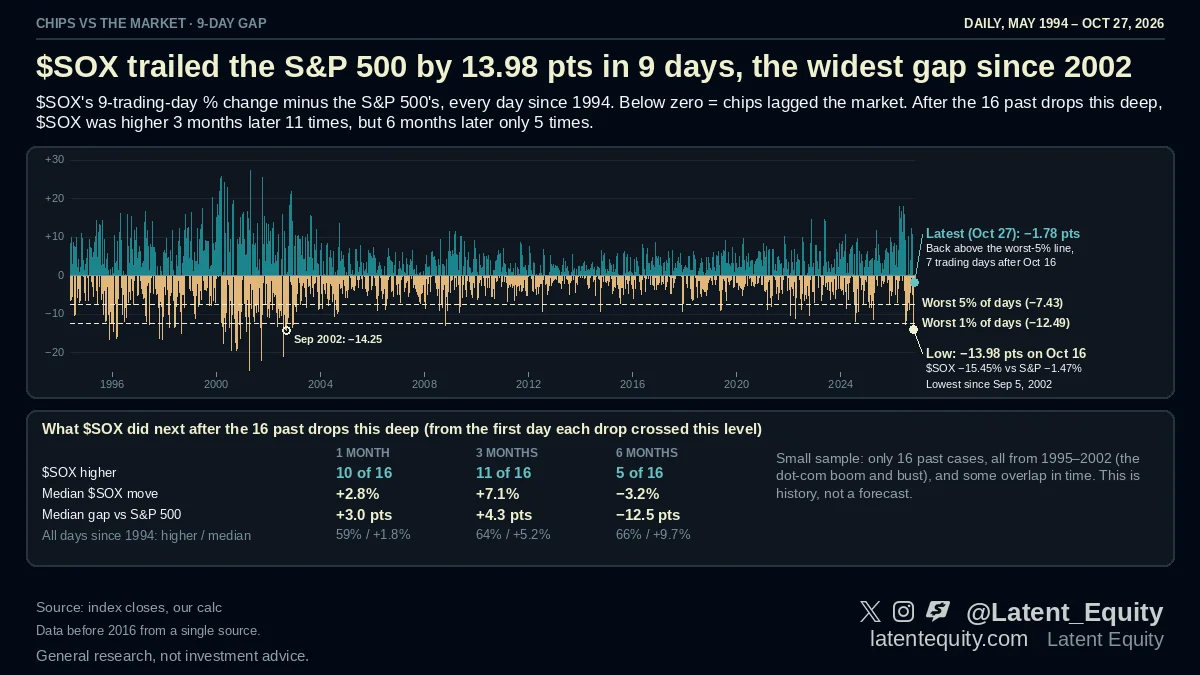
$SOX fell 13.98 points more than the S&P 500 over the 9 trading days to Oct 16 (-15.45% vs -1.47%), the widest gap since Sep 5, 2002 (our calc). By the Oct 27 close it was back to -1.78.
The gap is simple: $SOX's % change over 9 trading days minus the S&P 500's. Below zero means chips lagged.
It took 7 trading days to climb back above the worst-5%-of-days line (-7.43).
In the 16 past drops this deep, $SOX's median move from the day each drop first got this deep was +2.8% a month later and +7.1% after 3 months, but -3.2% after 6 months.
Caveat: all 16 come from 1995 to 2002, one boom and bust, and some overlap. It's history, not a forecast.
What would prove us wrong
Set before publication. We report back in public when one trips.
- the gap sinks back below -7.43 in the coming weeks. Open · next check: Ongoing: the 9-day gap vs the -7.43 line
Method and sources
Figures marked "our calc" are our own arithmetic on the cited primary sources (company filings, earnings releases, public datasets). Every figure was checked against its source before publication.
General research, the same for every reader. Not investment advice.