 Latent Equity
The S&P 500's 20 worst days: long waits, not quick bounces
Our read: the 20 worst moves in S&P 500 history are a story about long waits, not quick bounces. All 20 were eventually made back on price, but two took more than 20 years (our calc).
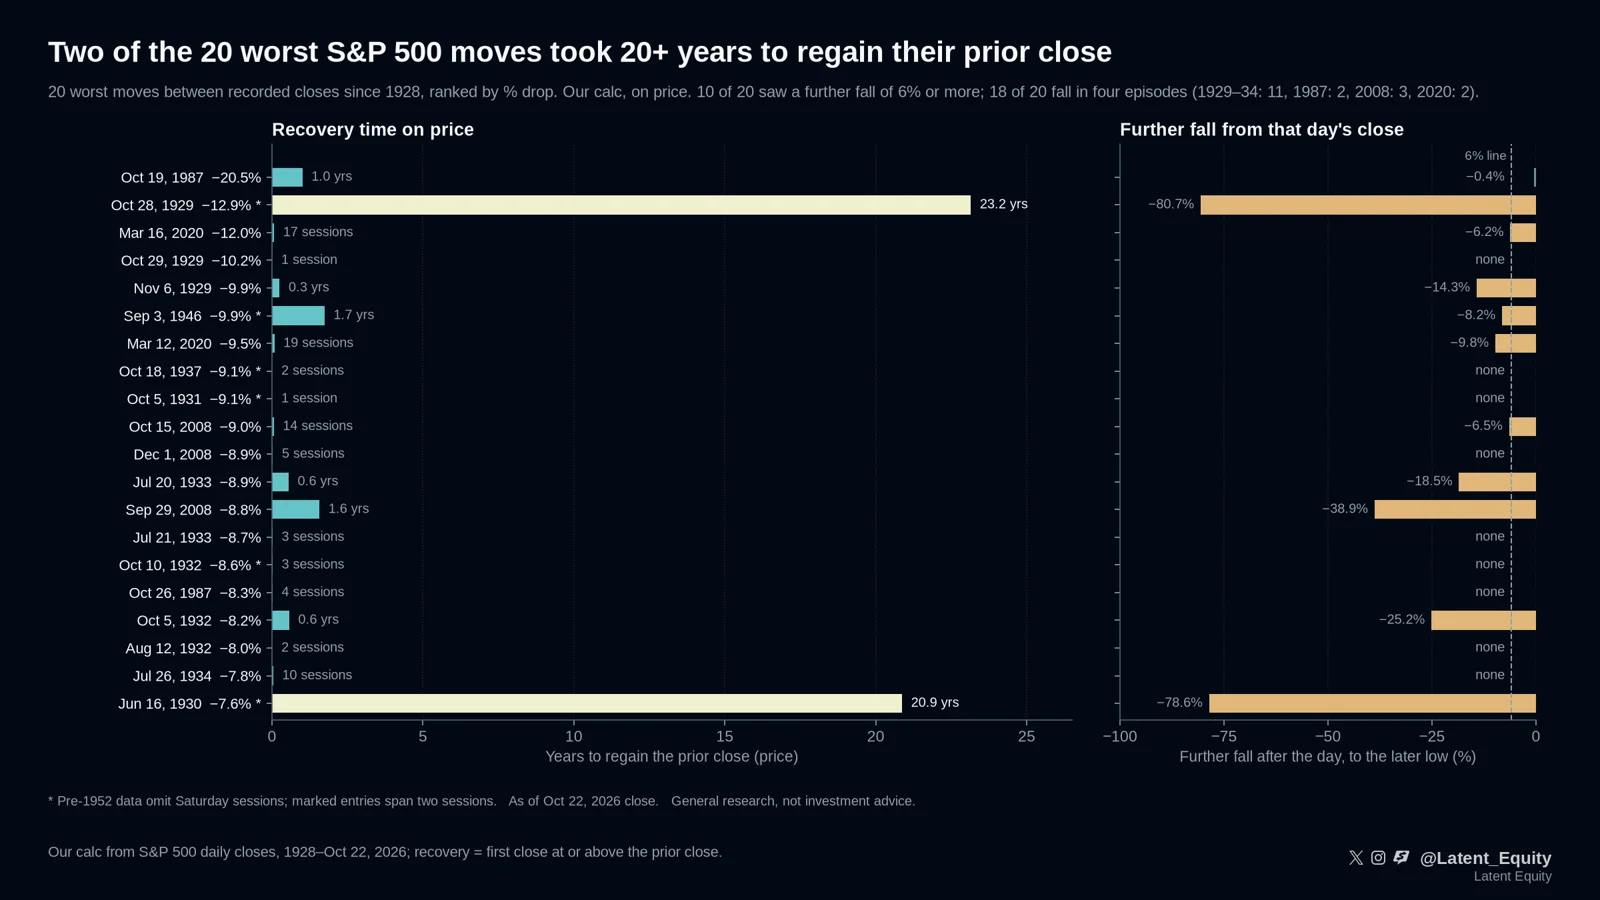
We ranked every recorded daily close since 1928 (pre-1957 the index tracked 90 stocks), after removing three suspect 1935 and 1938 prints (our screen). The worst was Oct 19, 1987, at -20.5%. The index got back to its prior close about a year later.
Pre-1952 the market also traded Saturdays, which this data omits, so six entries span two sessions (Saturday plus the next): Oct 28, 1929; Jun 16, 1930; Oct 5, 1931; Oct 10, 1932; Oct 18, 1937; Sep 3, 1946. They're the worst moves between recorded closes, not strict single days.
The two long ones, both two-session moves: Oct 28, 1929 (-12.9%) took 23.2 years to regain its prior close, and Jun 16, 1930 (-7.6%) took 20.9 years, on price (our calc). With dividends reinvested, the 1930 wait drops to about 6 years (our calc, approximate).
The worst day often wasn't the bottom. After 10 of the 20, the index fell at least another 6% before it recovered (our calc).
After Oct 28, 1929, it fell about another 81% by June 1932. After Sep 29, 2008, about another 39% by March 2009.
And these aren't 20 separate shocks. 18 of the 20 fall in four episodes: 1929-34 (11 of them), 1987, 2008 and 2020 (our calc). Bad days come in clusters.
The honest counterpoint: the S&P 500 is the index of a market that came back. Japan's Nikkei 225 peaked on Dec 29, 1989, and didn't close above that level until Feb 22, 2024, about 34 years later (our calc).
This is index-level only. Single stocks can go to zero, and past results don't guarantee future ones.
Which of the 20 surprised you most?
What would prove us wrong (our thresholds)
Set before publication. We report back in public when one trips.
- An S&P 500 drawdown that stays below its prior peak for longer than the 1929 episode, about 25 years on price. Open · next check: Ongoing: any S&P 500 drawdown
- A US path that looks like Japan's: no new price high for 30 years or more. Open · next check: Ongoing: S&P 500 price highs
Method and sources
Figures marked "our calc" are our own arithmetic on the cited primary sources (company filings, earnings releases, public datasets). Every figure was checked against its source before publication.
General research, the same for every reader. Not investment advice.