 Latent Equity
$SOXX's 8% drop and value's lead over growth: what history says
$SOXX fell 8.2% on Friday, its 12th-worst day since 2001 and its second 6%+ drop in six sessions. Only about 0.2% of trading days have been that bad (our calc).
Same day, value's lead over growth hit a 1-year high as our 15-stock chip basket had its 2nd-worst day in a year (-8.2%). Value = cheaper, steadier companies ($IWD); growth = faster-growing, pricier ones ($IWF). Over 20 trading days, $IWD is up 3.7% and $IWF is down 7.4%.
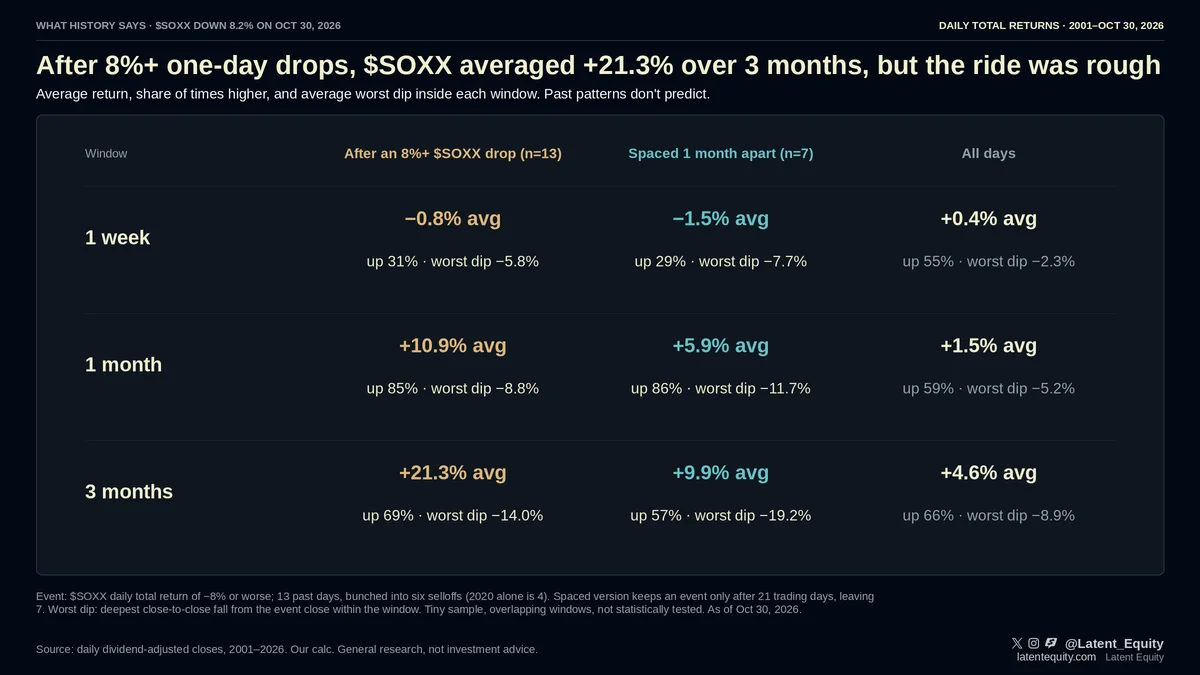
What history says. After the 13 past drops of 8% or more:
1 week later: avg -0.8%, up 31% of the time (all days: +0.4%, 55%)
1 month: avg +10.9%, up 85% (all days: +1.5%, 59%)
3 months: avg +21.3%, up 69% (all days: +4.6%, 66%)
The ride was rough: the avg worst drawdown inside those 3 months was -14.0%, vs -8.9% in a typical 3-month stretch.
Caveats: tiny sample, bunched into six selloffs (2020 alone is four of the 13), so windows overlap. Spaced a month apart, only 7 remain and the 3-month avg drops to +9.9%. Not statistically tested. Past patterns don't predict.
Next check: Next 8%+ $SOXX drop
Method and sources
Figures marked "our calc" are our own arithmetic on the cited primary sources (company filings, earnings releases, public datasets). Every figure was checked against its source before publication.
General research, the same for every reader. Not investment advice.